
The Achievement Gap We're Not Talking About
A quiet shift since 2015 has left America’s lower-performing students even further behind


In The Anxious Generation and on this Substack, Jonathan Haidt and Zach Rausch (co-author on this post) argue that the early 2010s marked the beginning of a youth mental health crisis. But mental health wasn’t the only domain in decline. Around the same time, student achievement in the United States in math, reading, and science also began to fall, after decades of slow but steady improvement.
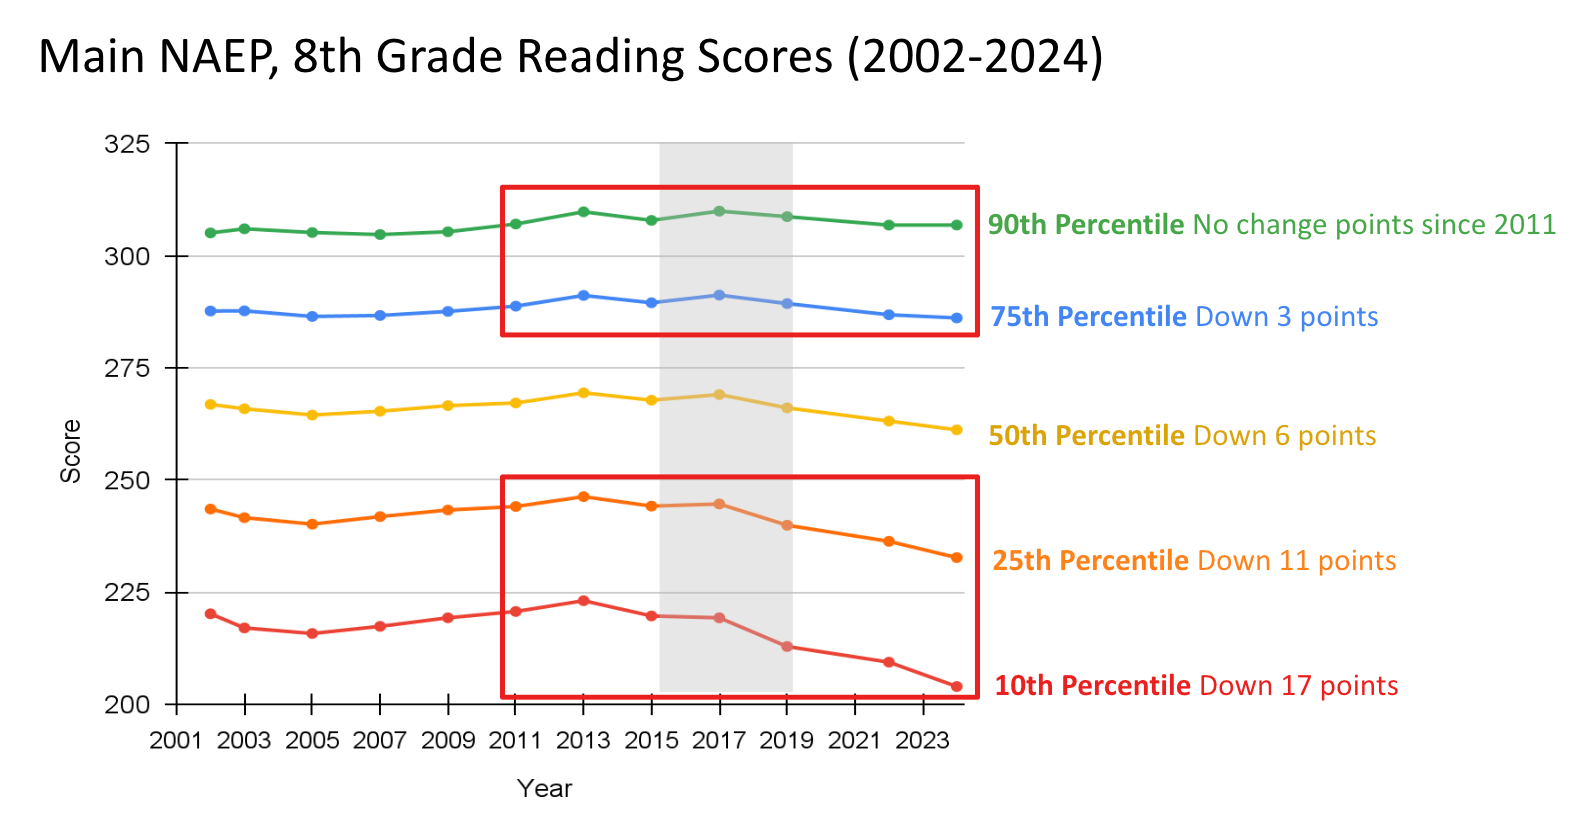
Although school closings and other COVID responses accelerated these trends, the pandemic cannot explain why the declines began in the early to mid 2010s. Peggy Carr, commissioner of the National Center for Education Statistics (NCES) has emphasized that the decline began before the pandemic and that it is not affecting all students equally. “Our lowest performing students are reading at historically low levels,” she noted. “There’s a widening achievement gap in this country and it has worsened since the pandemic.” As you can see in Figure 1 below, the drop in U.S. 8th grade reading and math scores since the mid-2010s has been driven largely by declining performance among the already lower-performing students.
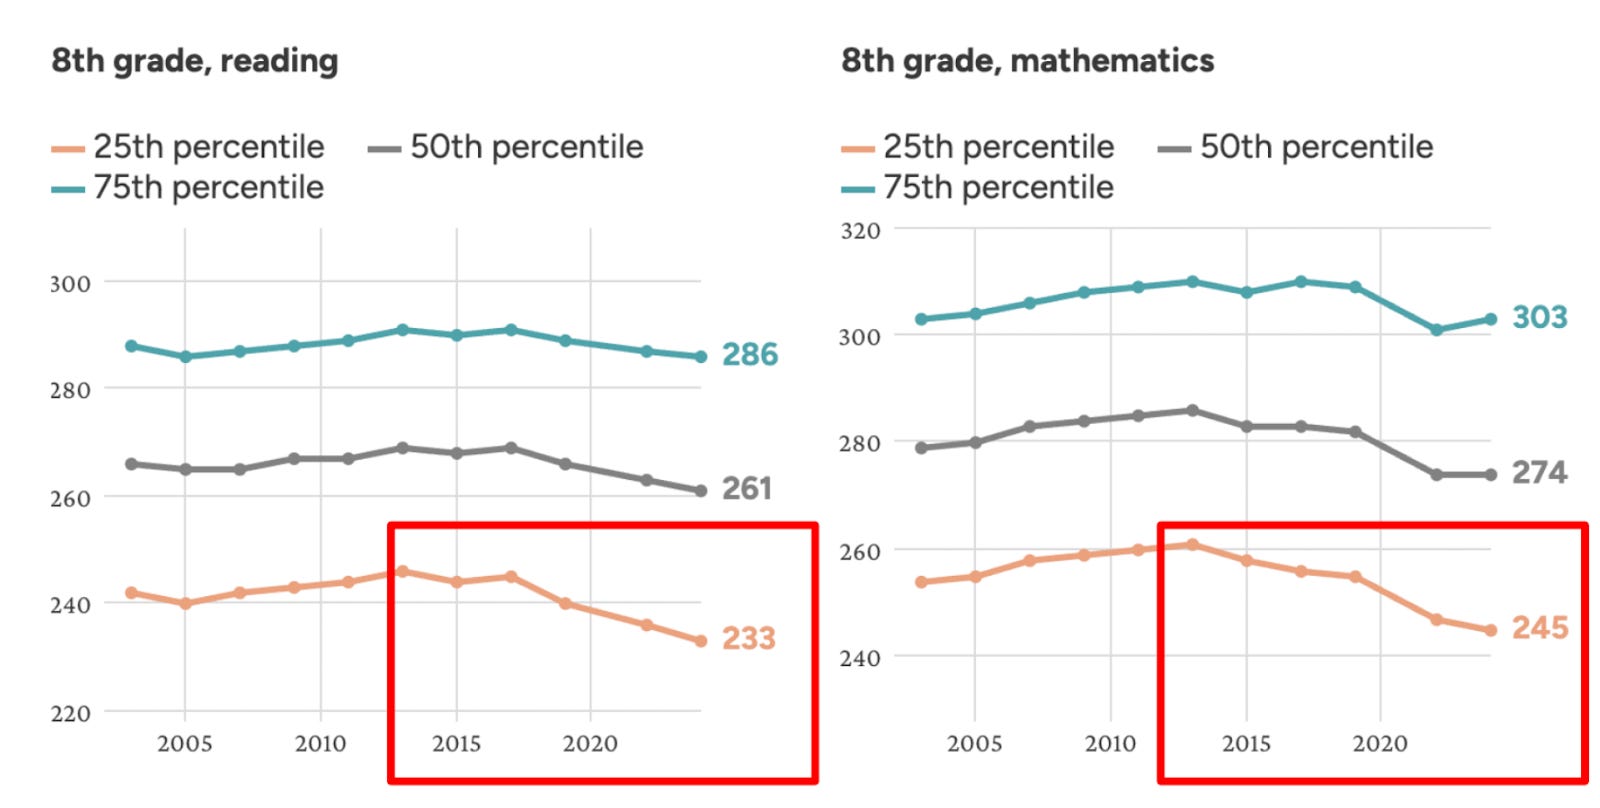
As you can see, this widening gap is not just a drop in average performance. It signals a deeper breakdown of educational equity in the United States. For decades, until around 2012, lower-performing students had been making steady gains. Now, we are watching those gains reverse at an unprecedented scale. In some cases, lower-performing students are doing as poorly as they were in the 1970s, when measurements began.
In the rest of this essay, we’ll show that this trend appears across every major U.S. educational dataset we’ve examined, it began around 2015, and it is occurring across — and within — all major demographic groups. In a forthcoming post, we’ll investigate whether this is just an American story.
Before we can explain what might be causing this shift, we need to document it more fully.
The Widening Gap: Introduction to NAEP, TIMSS & PISA
For decades, until around 2012, lower-performing students had been making steady gains. Now, we are watching those gains reverse at an unprecedented scale.
To understand how student performance has changed over time, we turn to three of the most widely used and respected assessments: The National Assessment of Educational Progress (NAEP), Trends in International Mathematics and Science Study (TIMSS), and the Program for International Student Assessment (PISA). Although the focus and content of some of these surveys shift to reflect curricular changes, the assessments are normed to allow for year-to-year comparisons.
The National Assessment of Educational Progress (NAEP, widely known as “the nation’s report card”) includes two key components. The Main NAEP is administered approximately every two years and is designed to reflect current curricular standards in U.S. schools, thus occasionally changing its focus and questions. In contrast, the NAEP Long-Term Trends (LTT) assessment has tracked 9- and 13-year-old students’ math and reading performance since the 1970s using a consistent format. Because the LTT remains unchanged over time, it provides a rare and valuable window into long-term shifts in academic performance, independent from curricular changes.
The Trends in International Mathematics and Science Study (TIMSS) is a global assessment of 4th and 8th grade students, administered roughly every four years since 1995. Sponsored by the International Association for the Evaluation of Educational Achievement (IEA), TIMSS evaluates how well students are learning math and science as taught in school. Like the Main NAEP, TIMMS is curriculum-based and aims to measure mastery of classroom content.1 However, unlike NAEP, it does not evaluate reading.
The third measure, the Programme for International Student Assessment (PISA), evaluates the performance of 15-year-old students’ performance in math, reading, and science. Administered every three years since 2000 by the Organization for Economic Co-operation and Development (OECD), PISA takes a different approach. Rather than assessing curriculum knowledge, it focuses on how well students can apply their knowledge and skills. This makes it especially useful for comparing education systems across countries with different curricula.
Each of these assessments has distinct strengths. Together, they provide a fuller picture of how student performance, and particularly the achievement gap, has evolved over time. For more details on NAEP, TIMSS, and PISA, please visit our academic trends review document.
The Growing High-Low Math Gap
Across all three major assessments (NAEP, TIMSS, PISA), the high-low math achievement gap in the United States has widened over the past decade. The data from all three show that this trend began before the pandemic, with the lowest performing students experiencing the steepest declines.
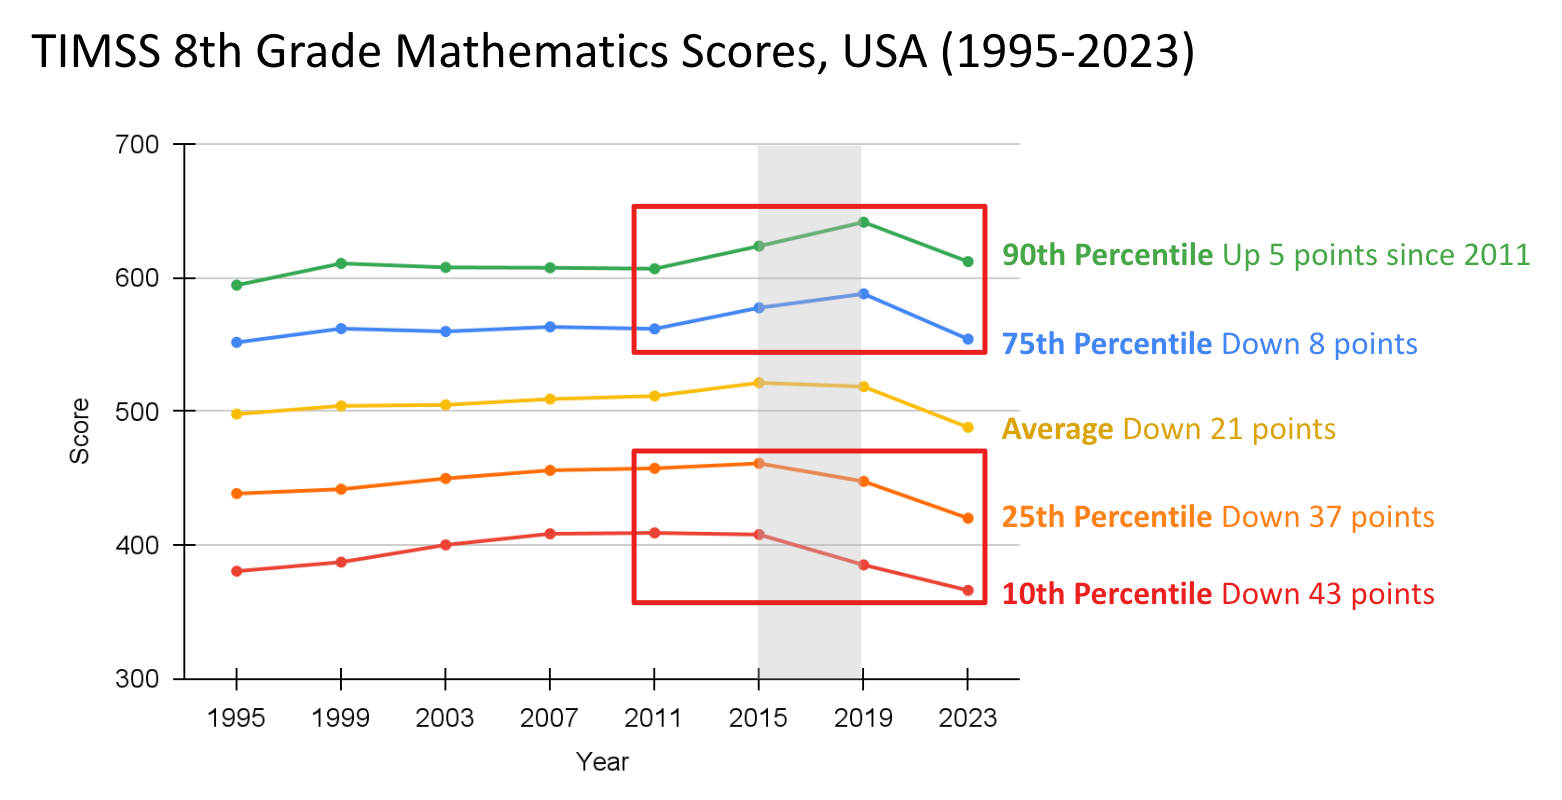
Results from TIMMS show a growing divergence in 8th grade math performance between high- and low-achieving students. As seen in Figure 2, since 2011, average scores (the yellow line) remained relatively stable, at least until 2023, the first year of measurement after the pandemic. However, students in the 90th percentile gained 5 points between 2011 and 2023, while those in the 10th percentile lost 43 points, marking a substantial widening of the gap.2 For context, the TIMSS performance benchmarks (low, intermediate, high, and advanced) are each separated by 75 points, so a change of 43 points represents a meaningful shift in student performance.
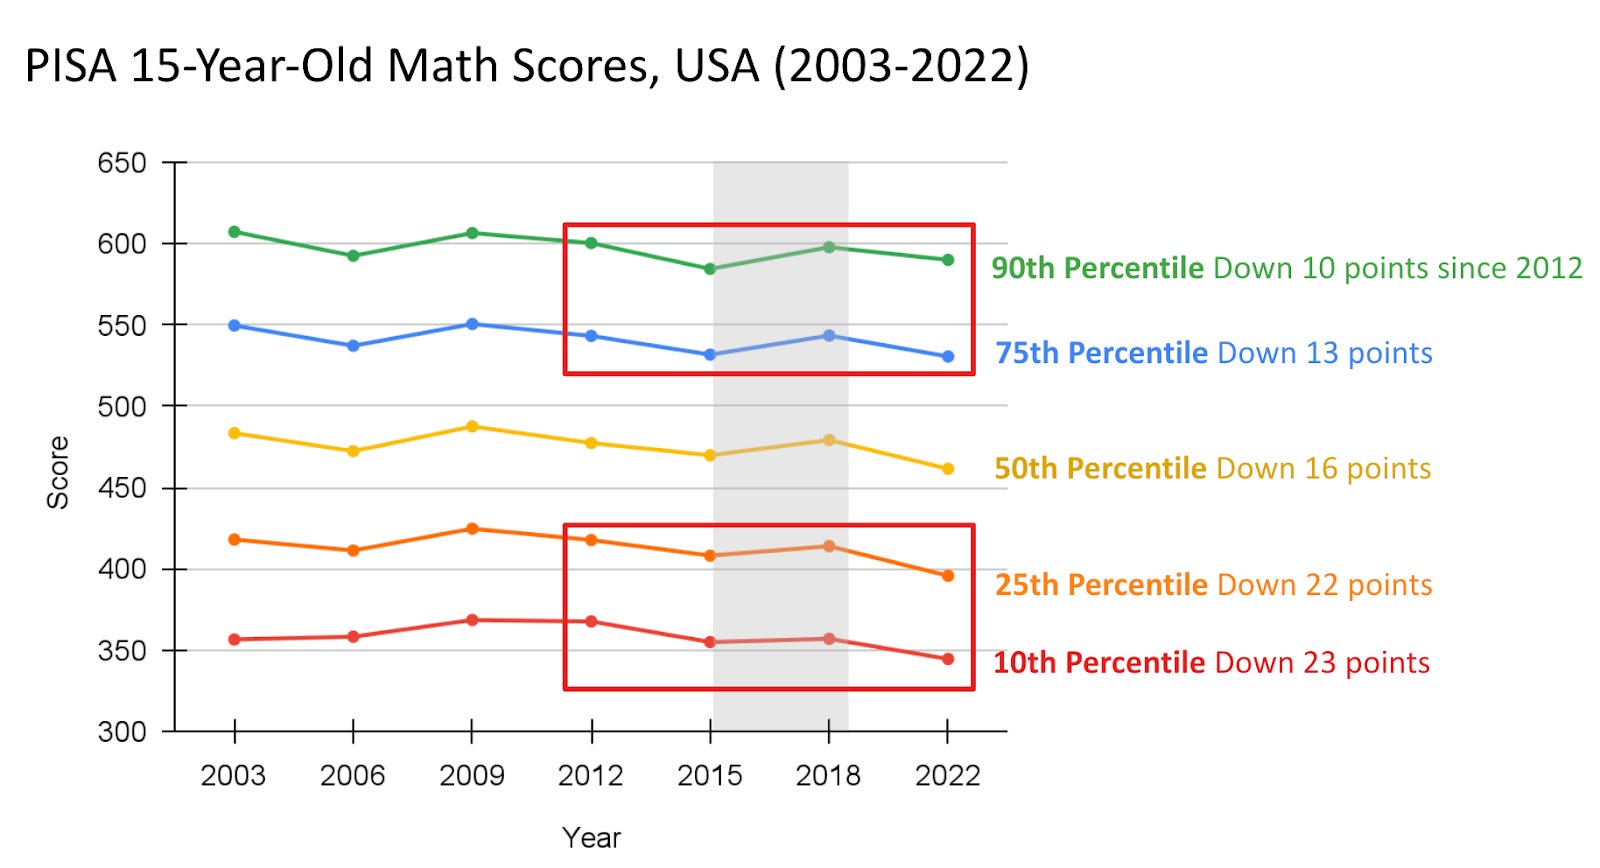
The PISA dataset tells a similar story. As shown in Figure 3, between 2012 and 2022, the math scores of those in the bottom quartile (below the 25th percentile) dropped by more than 20 points, about a fifth of a standard deviation. Students in the top quartile (above the 75th percentile) also declined, but by only about half as much.
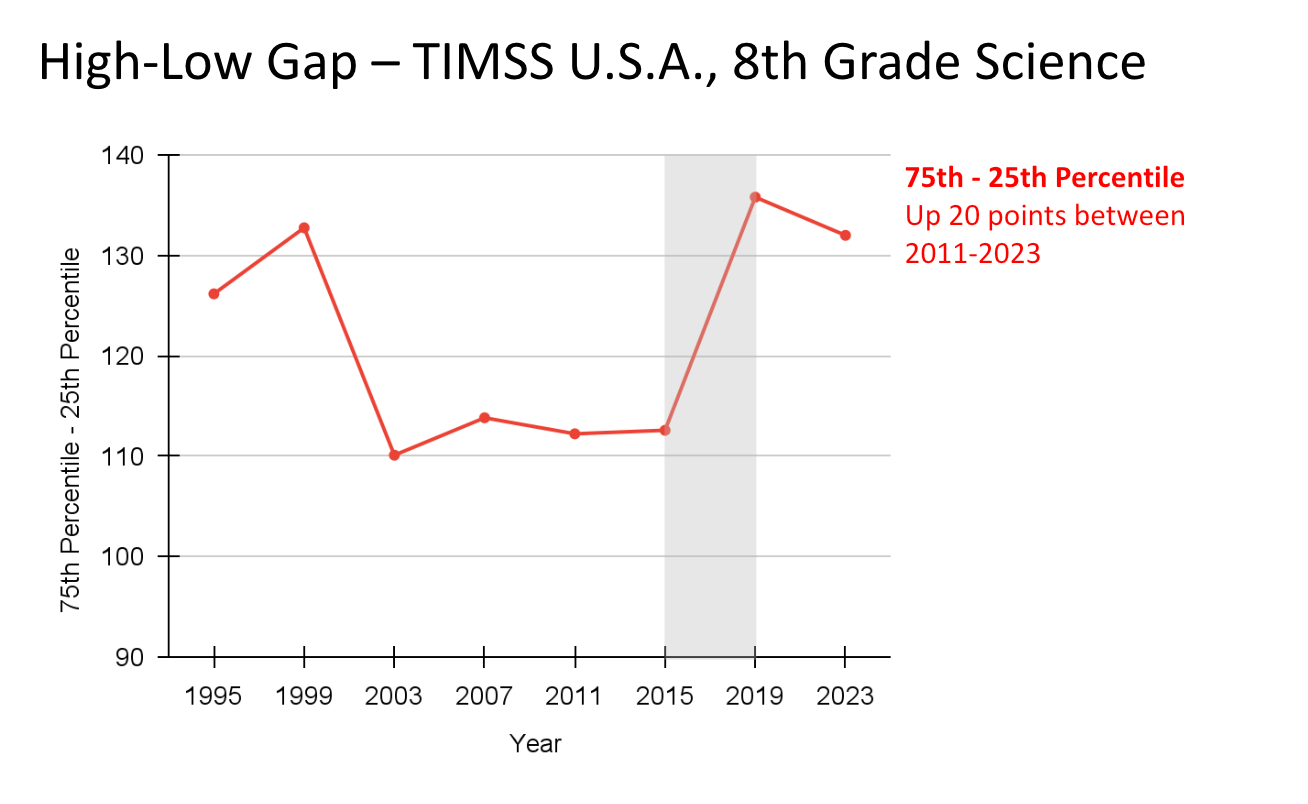
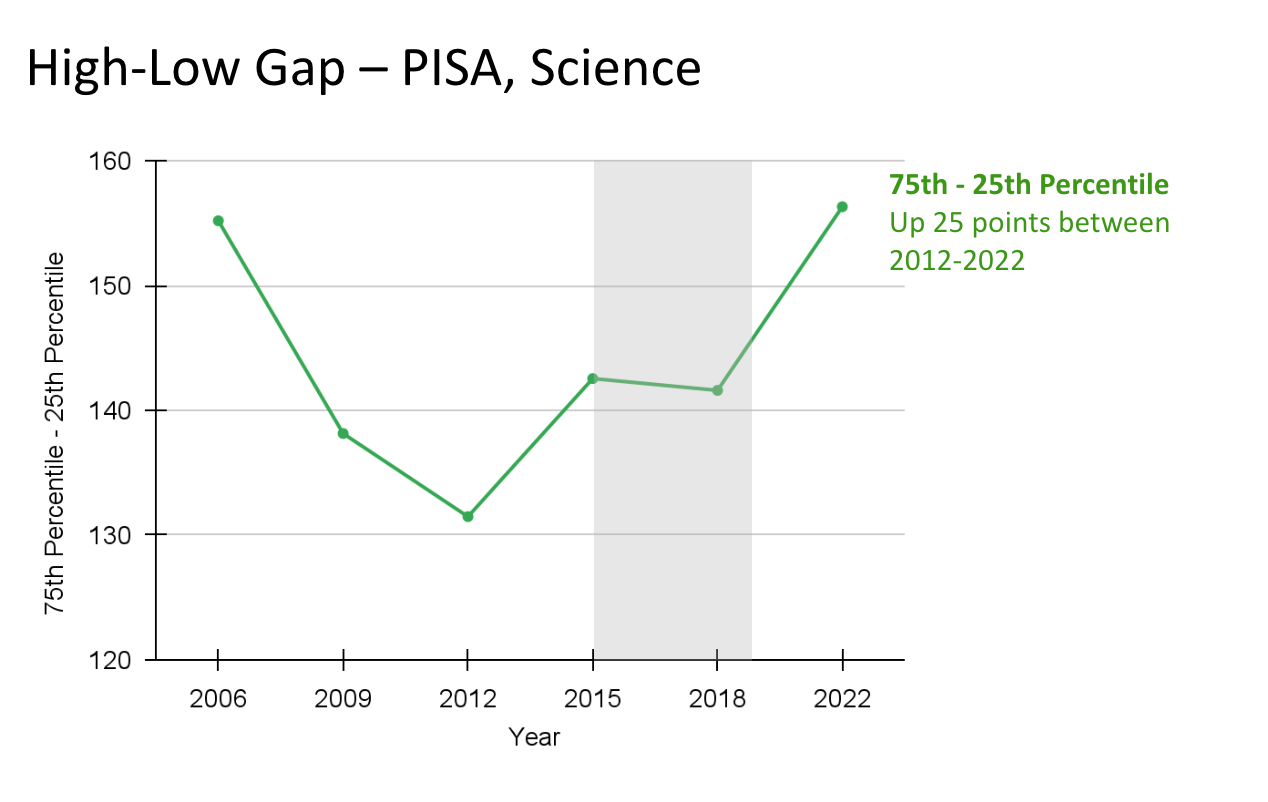
Across all three assessments, it is clear that the lowest performing students are falling behind in math. To quantify this widening gap, we calculated the high-low gap as the difference between the scores of students at the 75th and 25th percentiles. Figures 4 through 6 show how this gap has changed over time across the three assessments.
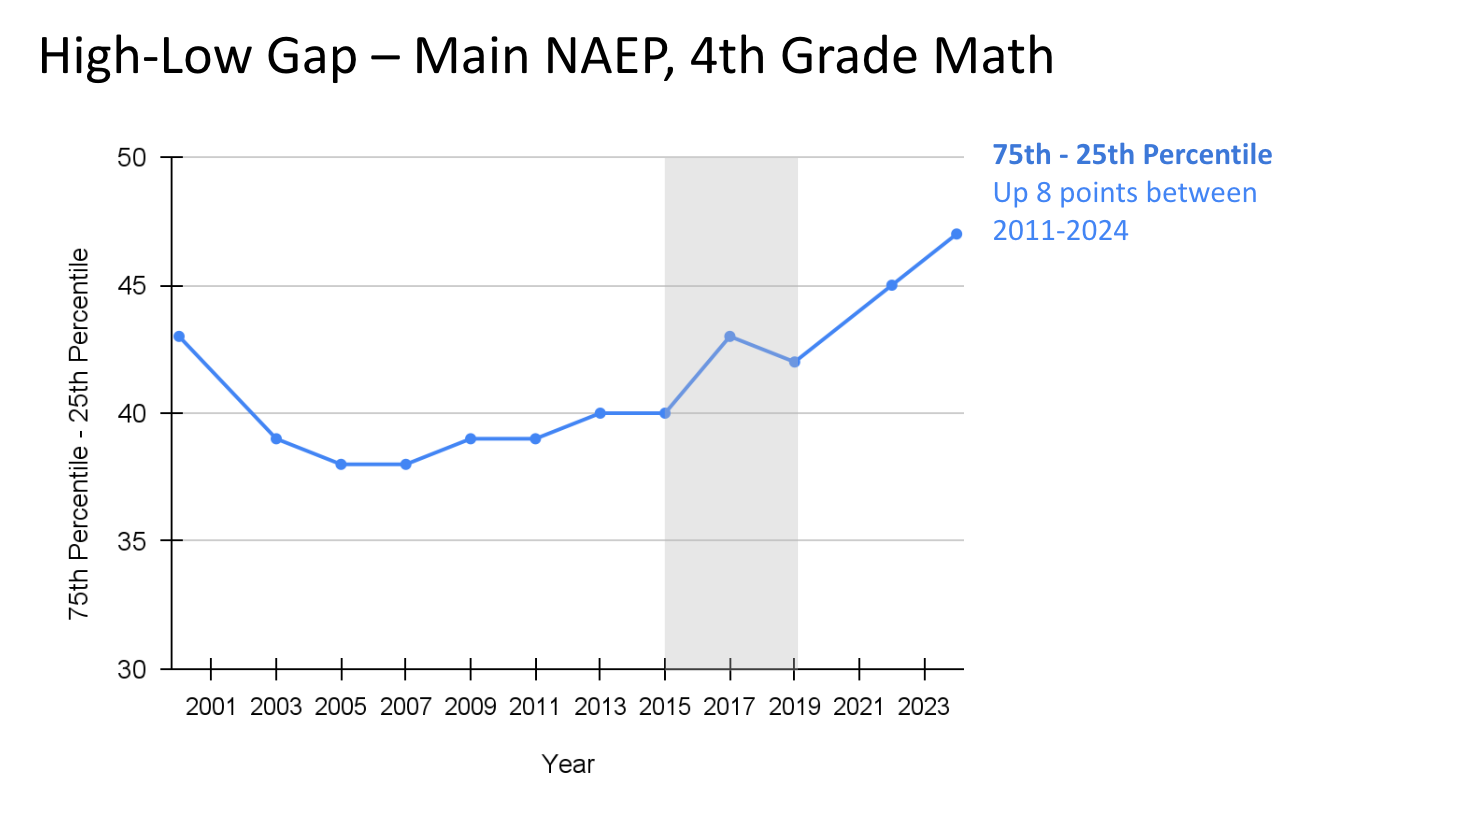
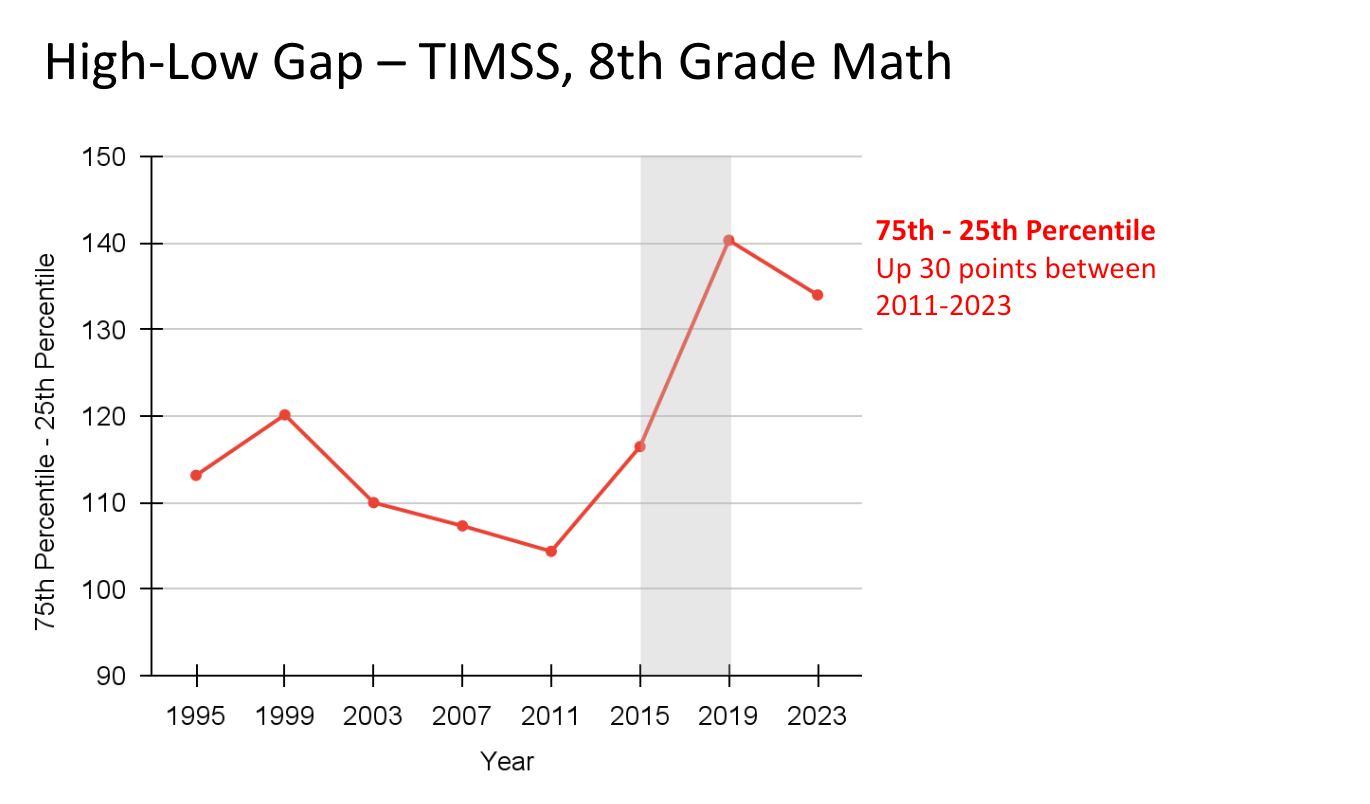
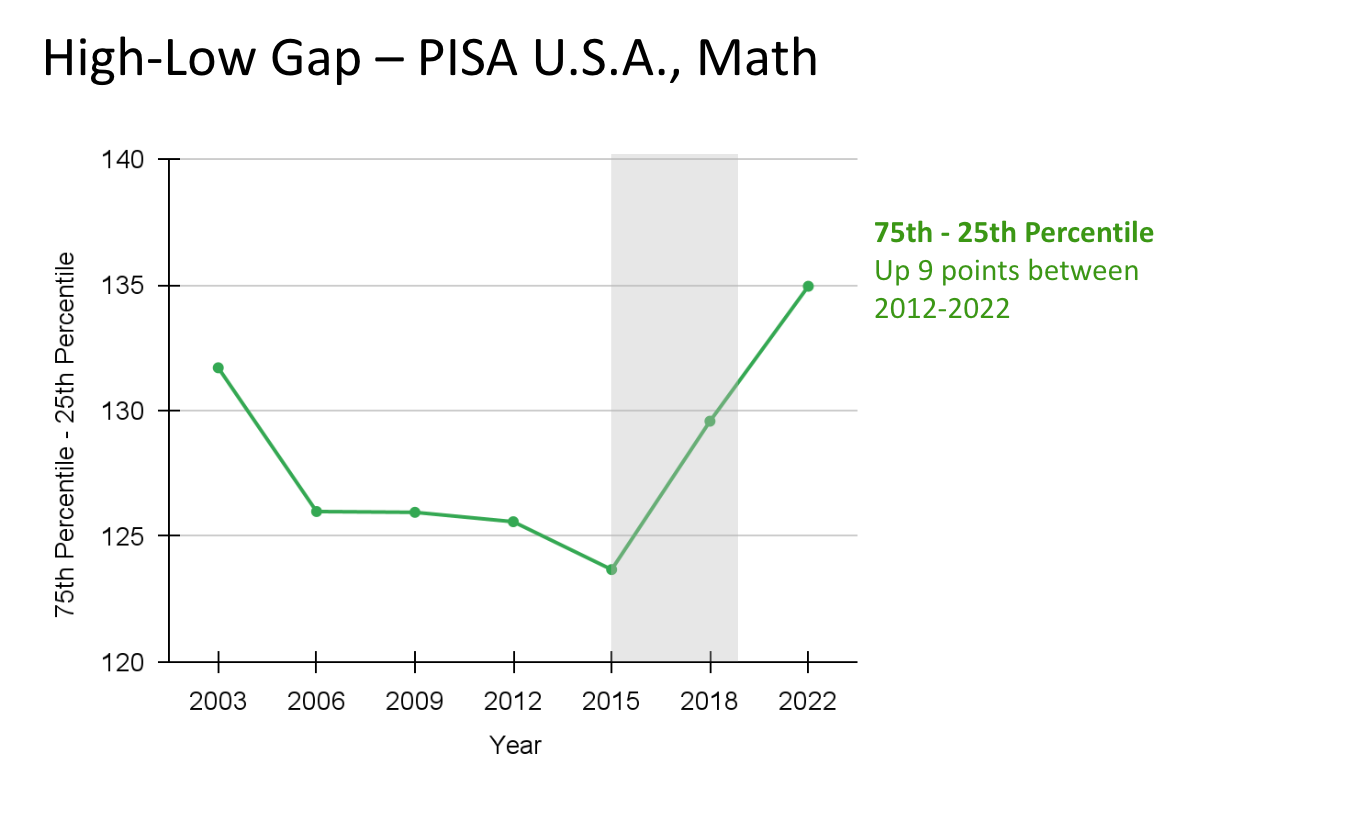
While each survey uses different scoring systems and evaluates math skills in different ways, the trend is consistent: After remaining flat or decreasing in the first decade of the 21st century, the gap between the highest and lowest performing students has been increasing in the U.S. since the early to mid 2010s.
The Growing High-Low Reading Gap
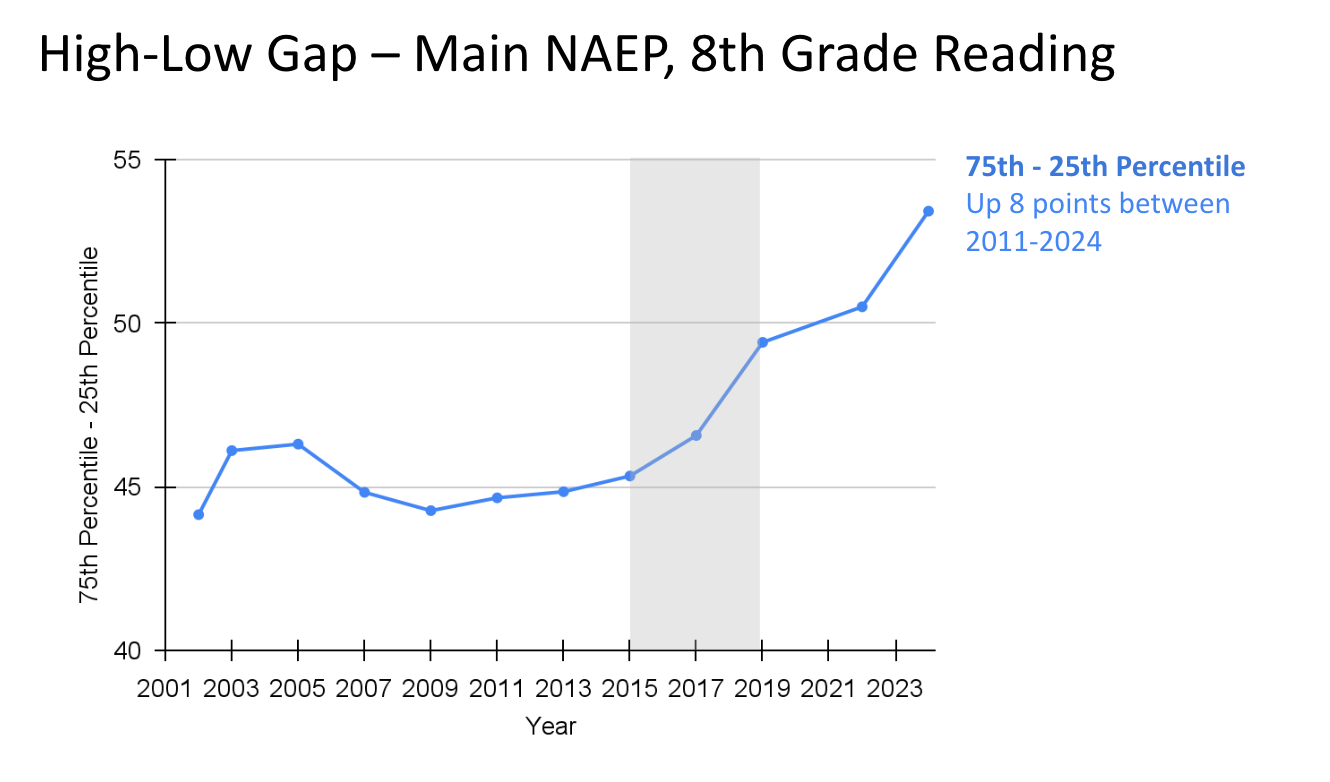
Reading trends in the United States mirror the math results: scores for lower-performing students have declined significantly, while scores for higher-performing students have remained steady or improved. NAEP and PISA measure reading, while TIMSS does not. NAEP data show that average 8th grade reading scores declined slightly between 2011 and 2024. But this modest overall drop masks a large high-low gap. As shown in Figure 7, scores for students at or above the 75th percentile remained relatively stable, while the scores of students at or below the 25th percentile have been steeply falling since 2017.
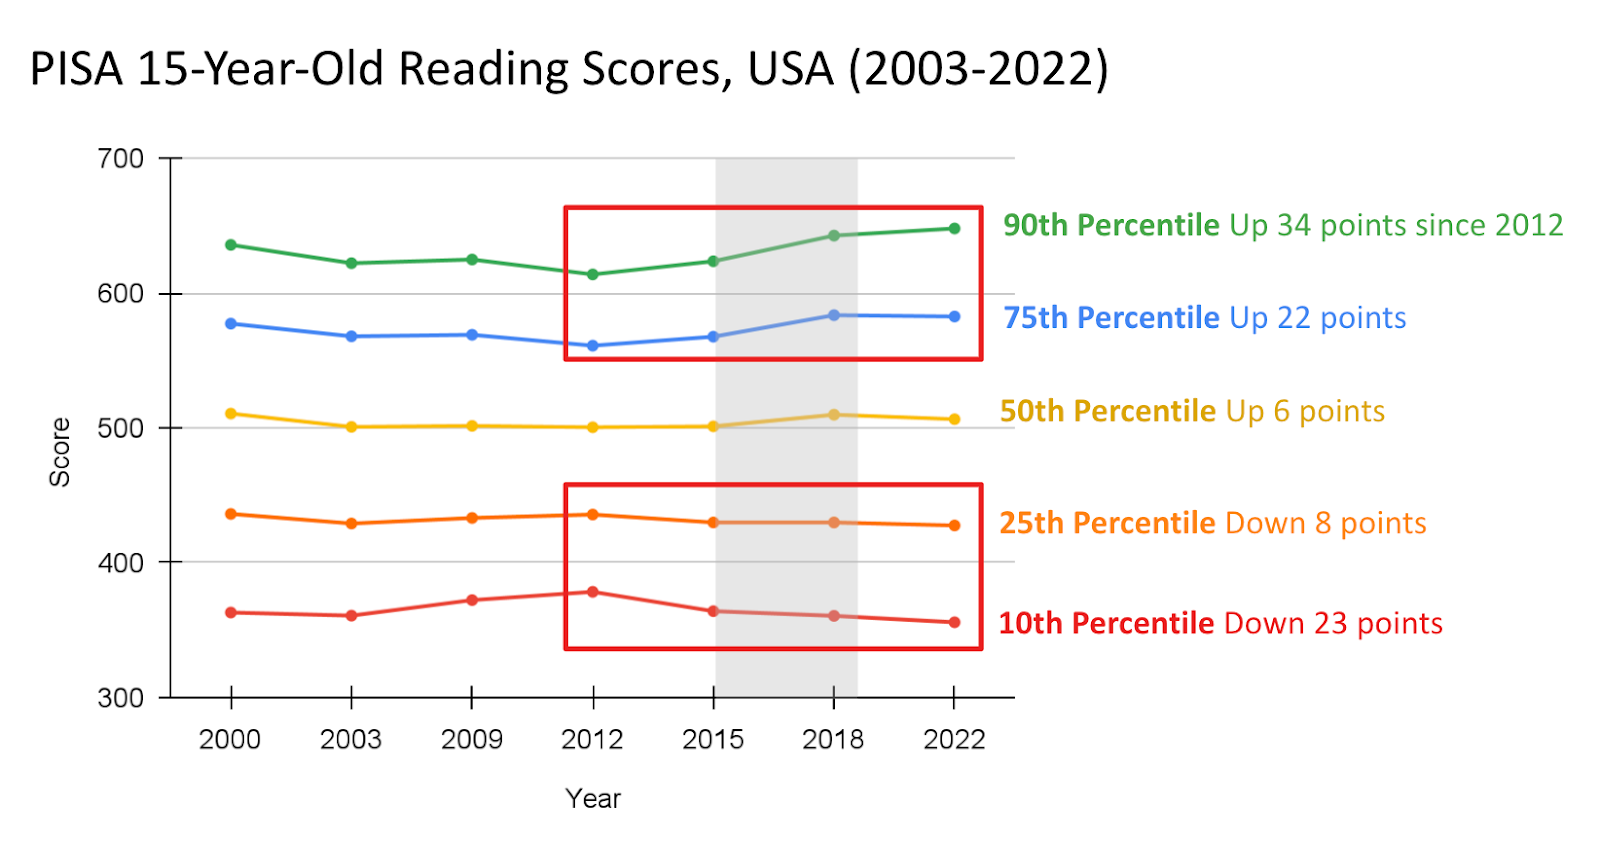
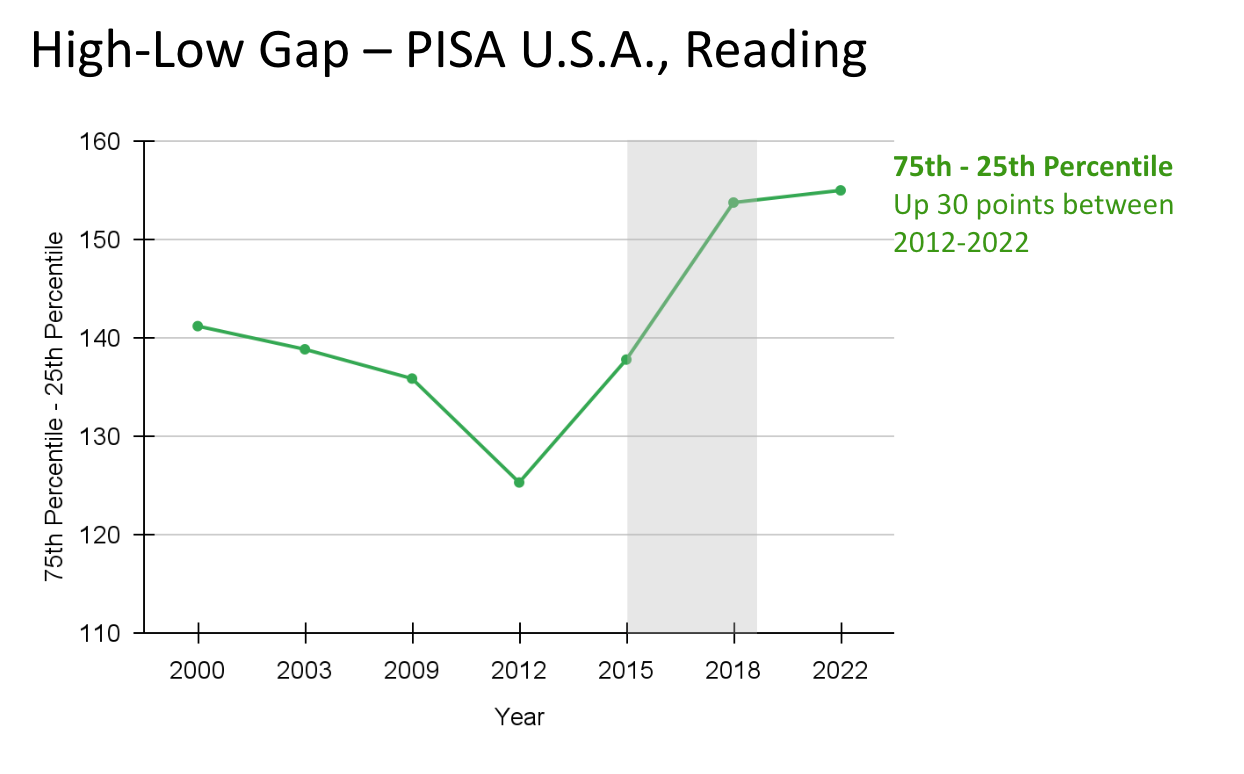
The PISA results tell a similar story. Between 2012 and 2022, the average reading score of U.S. 15-year-olds increased slightly. But that modest rise was driven by gains among top performers: scores at the 90th percentile rose by about a third of a standard deviation, while scores at the 10th percentile dropped by roughly a quarter of a standard deviation. As shown in Figure 8, the divergence in reading performance appears to have begun shortly after 2012.
The growing divide between higher and lower performing students becomes even more apparent when we look at the high-low gap. Figures 9 and 10 show that this gap has widened steadily since the early 2010s in both NAEP and PISA reading assessments.
The Growing High-Low Science Gap
Trends in science performance, as measured by TIMSS and PISA, reinforce the story we’ve seen in math and reading: the high-low achievement gap has widened over the past decade.
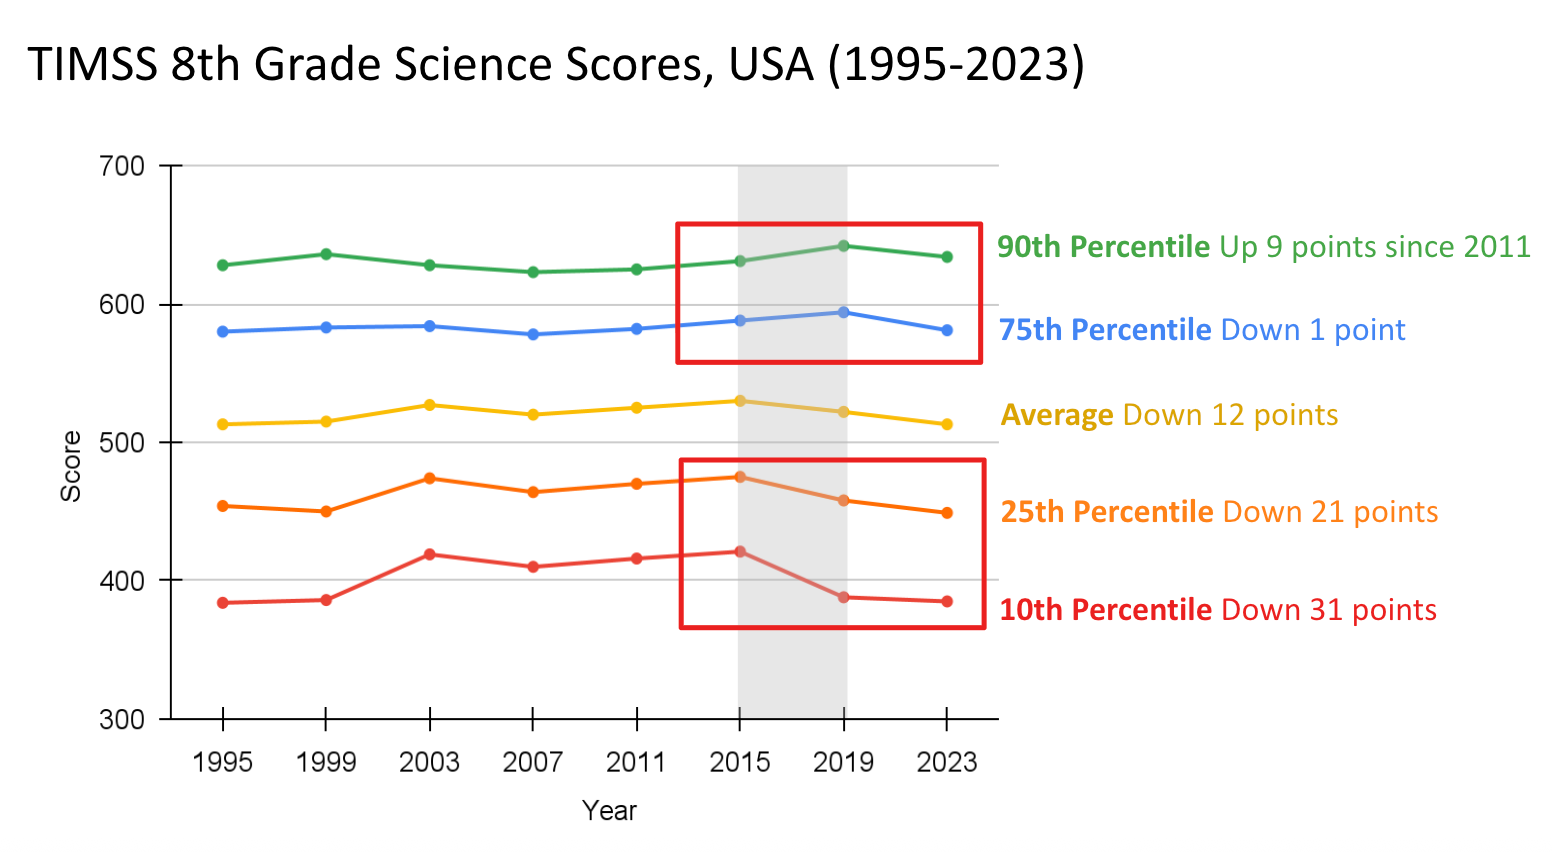
In the TIMSS data, we can see that between 2011 and 2023, the overall average 8th grade science score remained relatively stable. But this masked a growing divide. As you can see in Figure 11, the scores of all students dropped during the pandemic. But a sudden burst of inequality caused the high-low gap to expand between the 2015 and 2019 administrations. The top two lines tilt upward during that period, while the bottom two lines tilt downward.
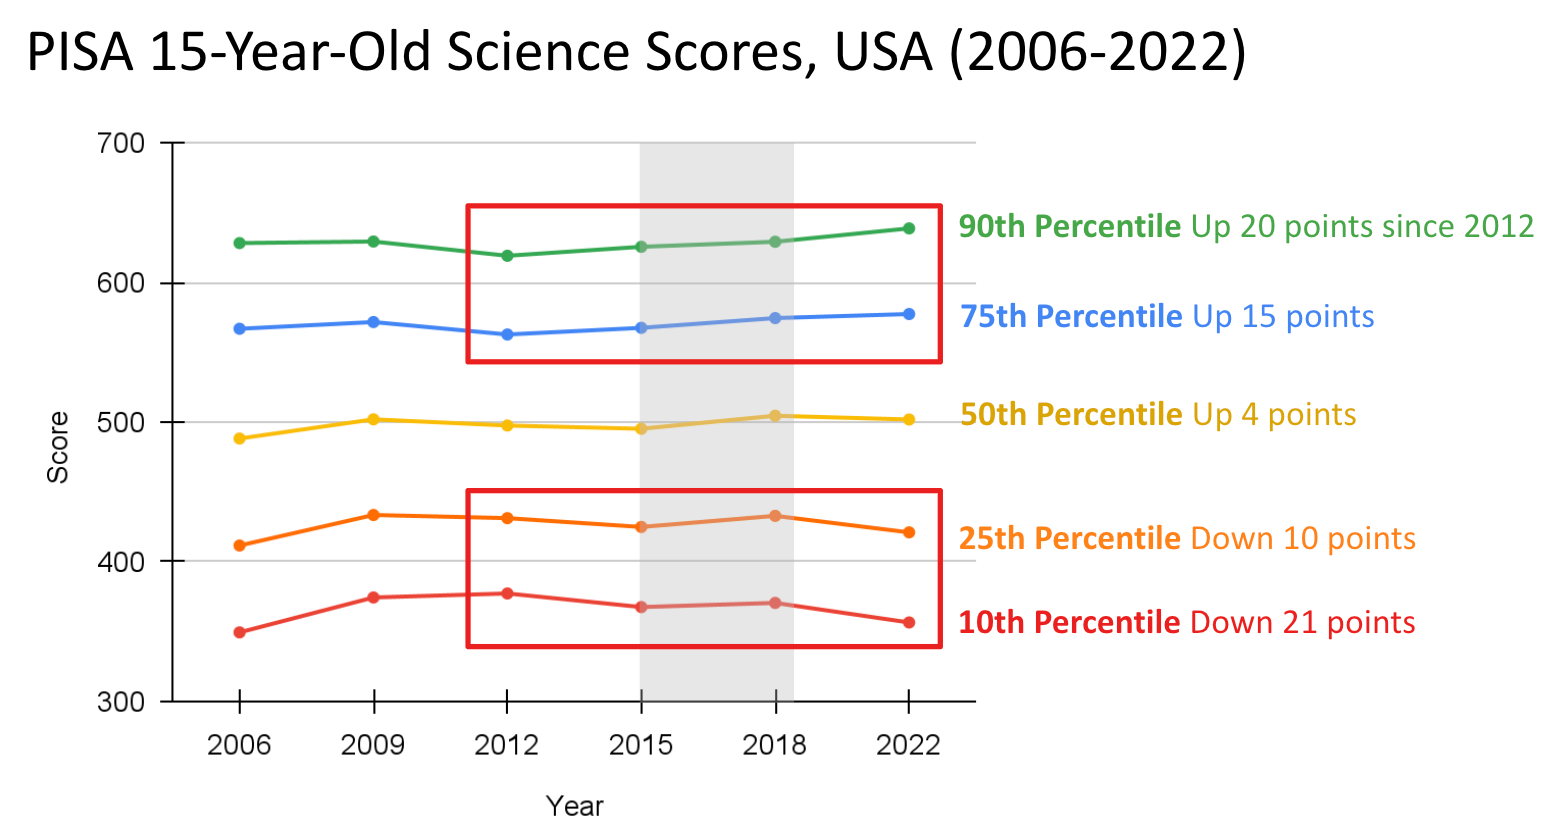
PISA data shows a variation on the same pattern among 15-year-olds. Between 2012 and 2022, average science scores increased slightly. However, this average rise was again driven by top performers. Scores above the 75th percentile rose by 12 points, while scores below the 25th percentile fell by nearly the same amount.
The graphs below show that the high-low gap for TIMSS began to increase after 2015, while the gap for PISA began to increase after 2012. Both gaps had been declining in prior years.
Across all the subjects — math, reading, and science — and across all three major surveys — NAEP, TIMSS, PISA — the same general pattern holds: the achievement gap between higher and lower performing students has been widening since the mid-2010s. The trends are even more prominent when we look at how the difference between students scoring the 90th percentile and 10th percentile has changed over the years. Please visit this slidedeck to view the 90th-10th graphs.3
Is there a widening achievement gap between demographic groups? No.
In the U.S., the term “achievement gap” is commonly used to refer to differences in average test scores between demographic groups — such as White and Black students, higher- and lower-income students, or boys and girls. In this section, we use demographic data from NAEP to examine how these gaps between groups have changed since the mid-2010s. We chose to use NAEP because the larger sample size allows NAEP to measure “U.S. students’ performance with a greater level of precision than TIMSS or PISA.” The larger sample size allows us to break the data down into smaller demographic subgroups.
Please visit this slidedeck if you would like to view our graphs of the demographic achievement gaps for gender, income, and race/ethnicity.
Gender. In math, boys slightly outperform girls on average, while in reading, girls slightly outperform boys. These gaps have remained relatively stable over the past decade. Although average scores have declined somewhat for both groups, the rate of change has been nearly identical. To see our graphs, visit our slidedeck.
Income. Higher-income students continue to score above lower-income students, as they have for decades. However, the size of this gap has not significantly changed since 2011. To see our graphs, visit our slidedeck.
Race and ethnicity. Asian students have seen slightly better changes in average outcomes than other racial groups since 2011, but the differences are small. For all other racial and ethnic groups, the trends have been broadly similar. To see our graphs, visit our slidedeck.
In short, while achievement gaps between demographic groups remain, they have not changed substantially over the past decade. This stands in contrast to the high-low gap — the widening divide between top- and bottom-performing students — which has grown consistently across subjects, grade levels, and surveys.
Does the high-low gap increase within demographic groups? Yes.
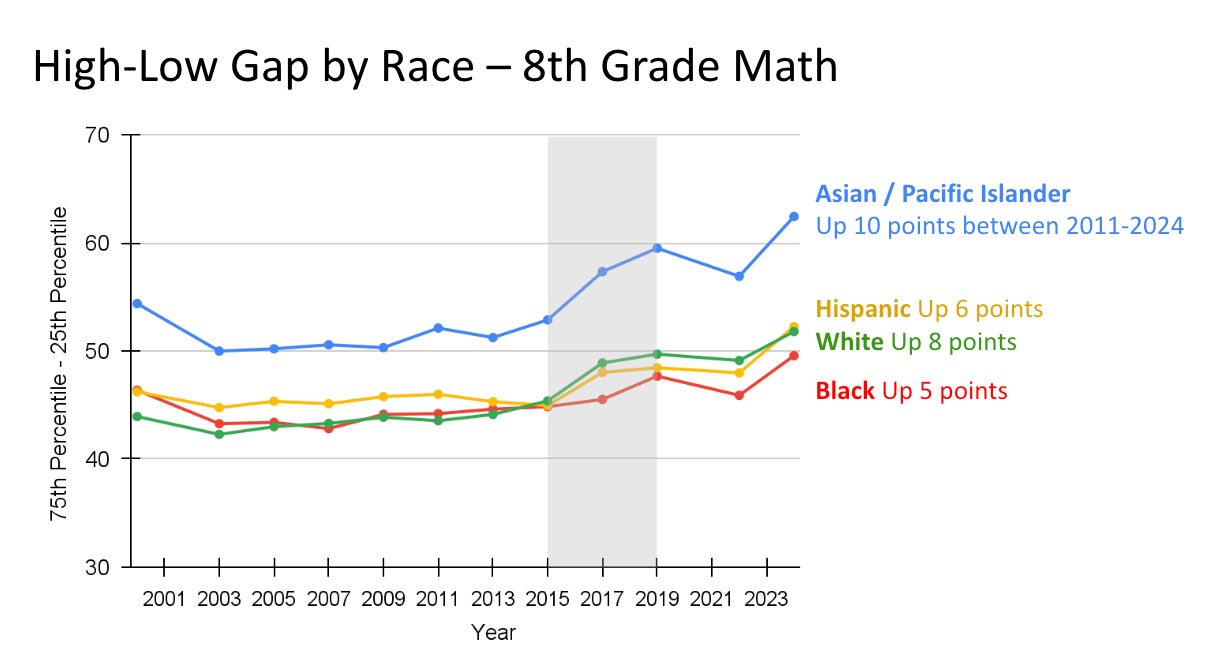
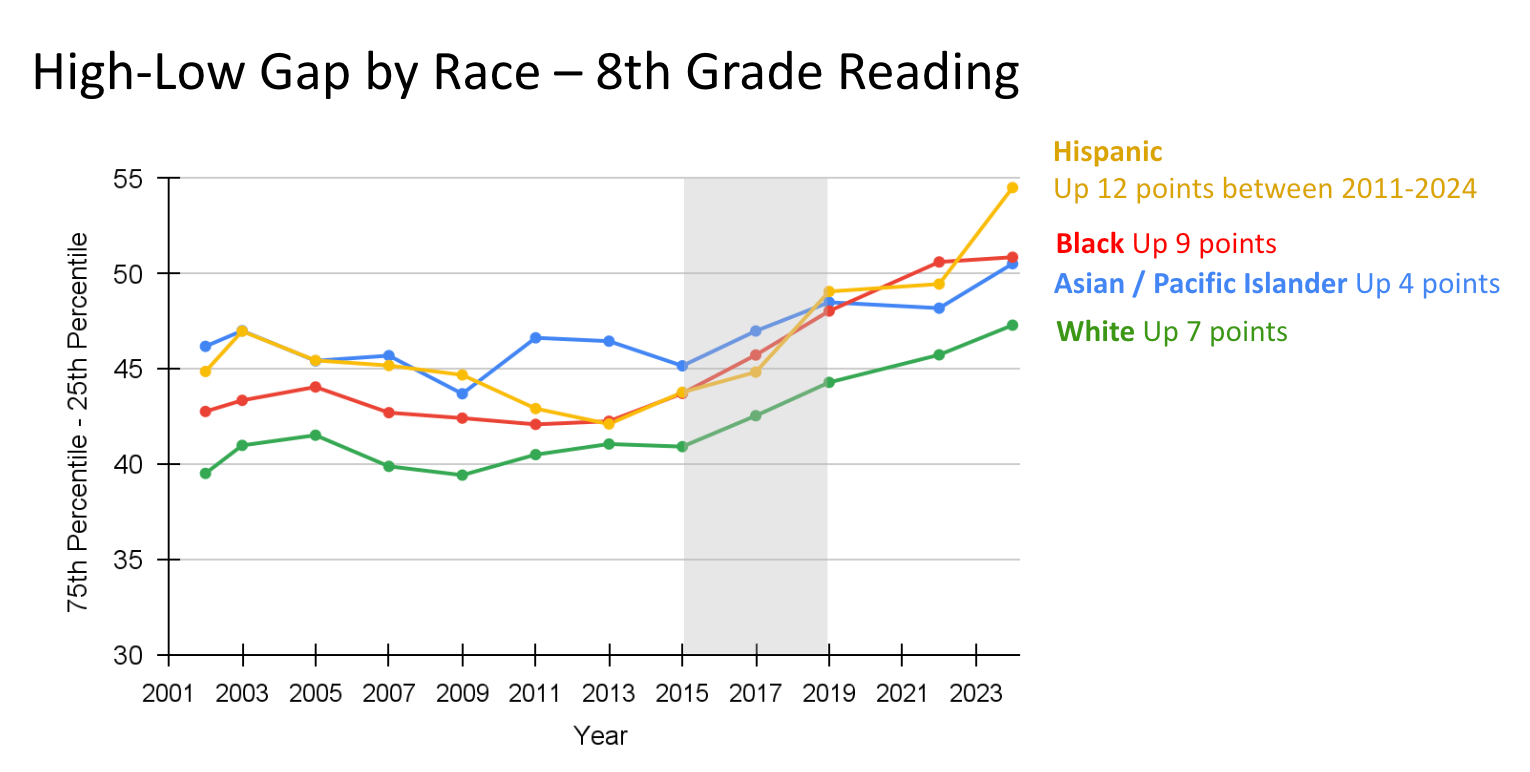
To understand the nature of the high-low gap, we examined whether it is growing within demographic groups. In other words: are top- and bottom-performing students drifting further apart even within the same race, gender, or income category? This analysis may shed light on possible causes of the change, by showing which groups are most affected by it.
We focus here on 8th grade NAEP scores, though similar patterns can be observed in 4th grade data (available here).
Race
As shown in Figures 15 and 16, the 75th–25th percentile gap within each racial group (White, Black, Hispanic, and Asian/Pacific Islander) has been widening steadily since 2015. For example, while average scores for Asian students may have remained flat or slightly increased, the gap between highest- and lowest-performing Asian students has grown. The same is true for all other racial groups. These trends suggest that the increasing high-low gap isn’t limited to any one racial group, but is happening within each racial group.
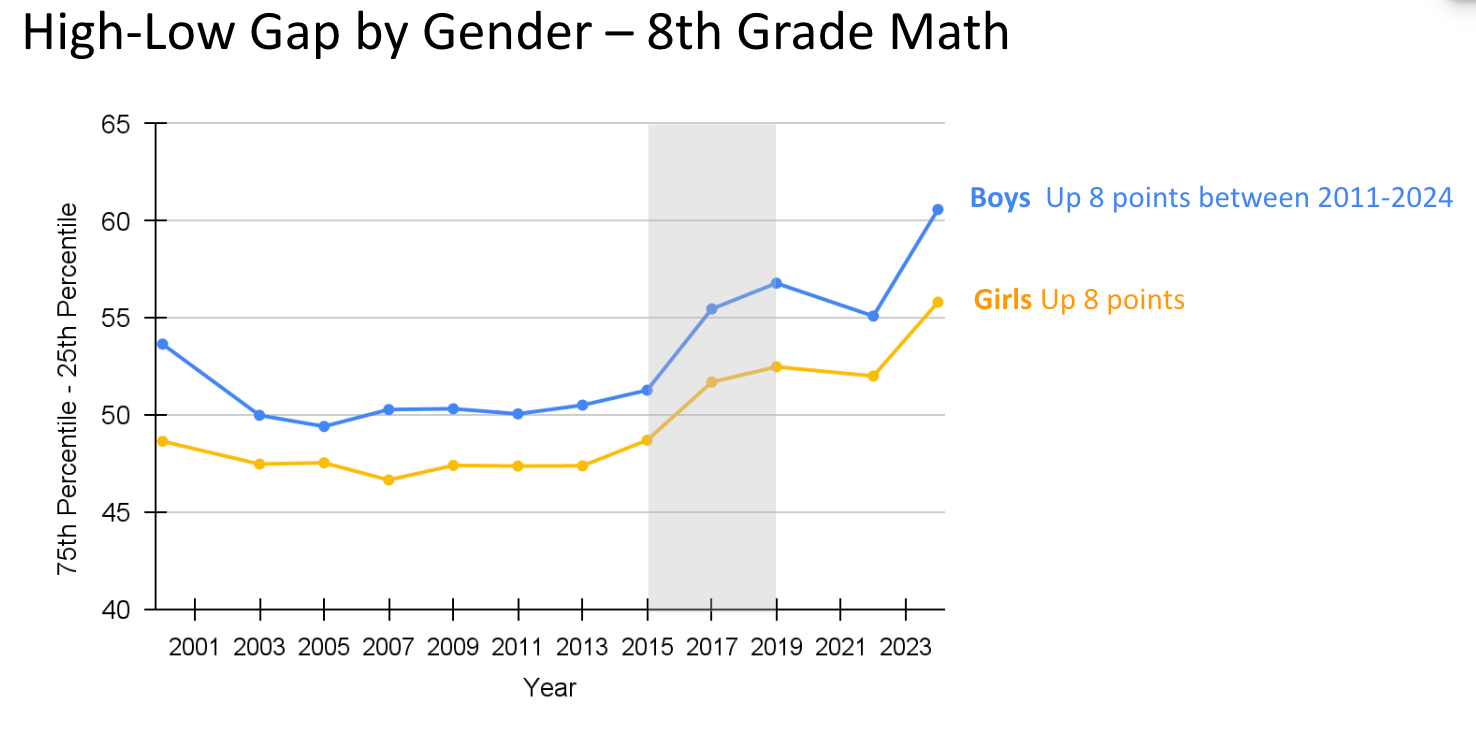
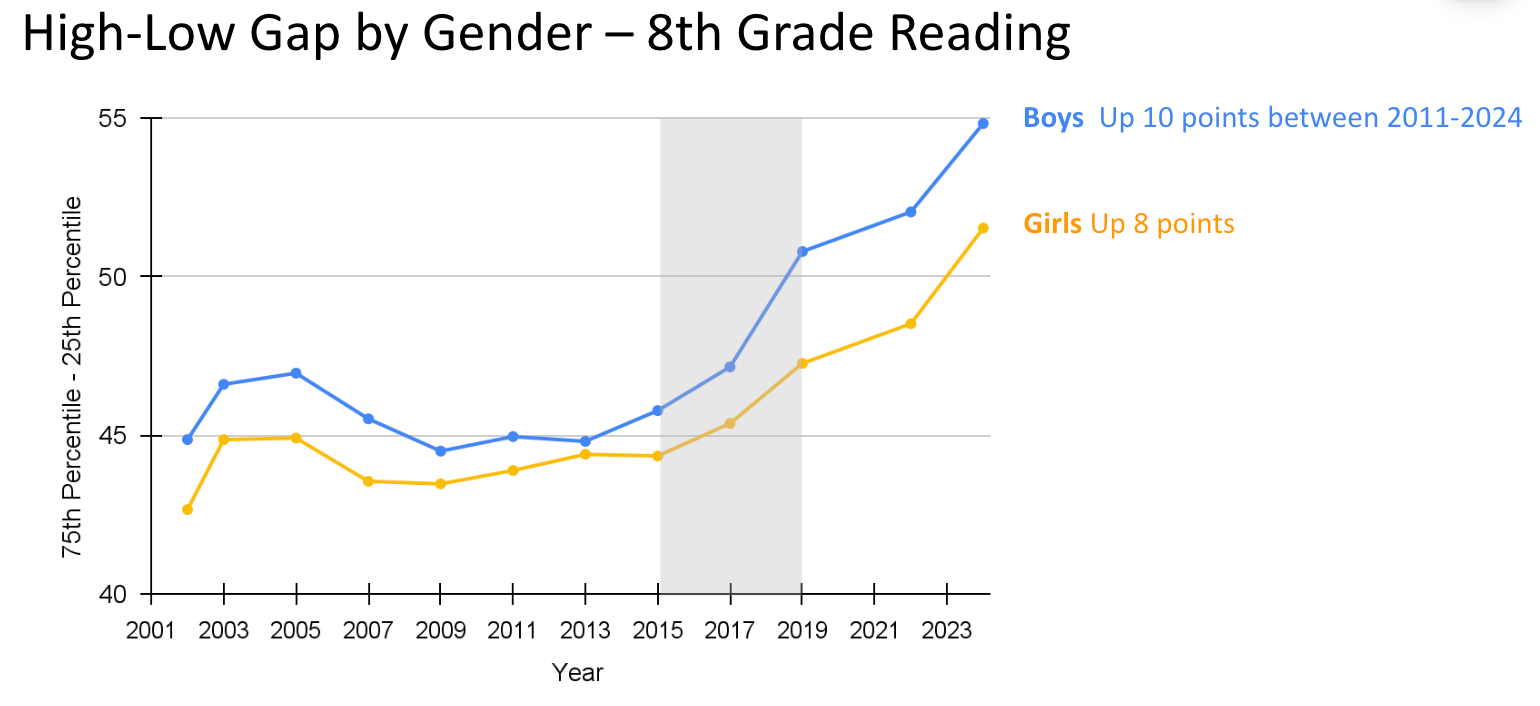
Gender
The widening high-low gap is also evident within gender groups. Since 2011, the difference between the 75th and 25th percentile scores has increased at nearly the same rate for boys and for girls, in math and in reading.
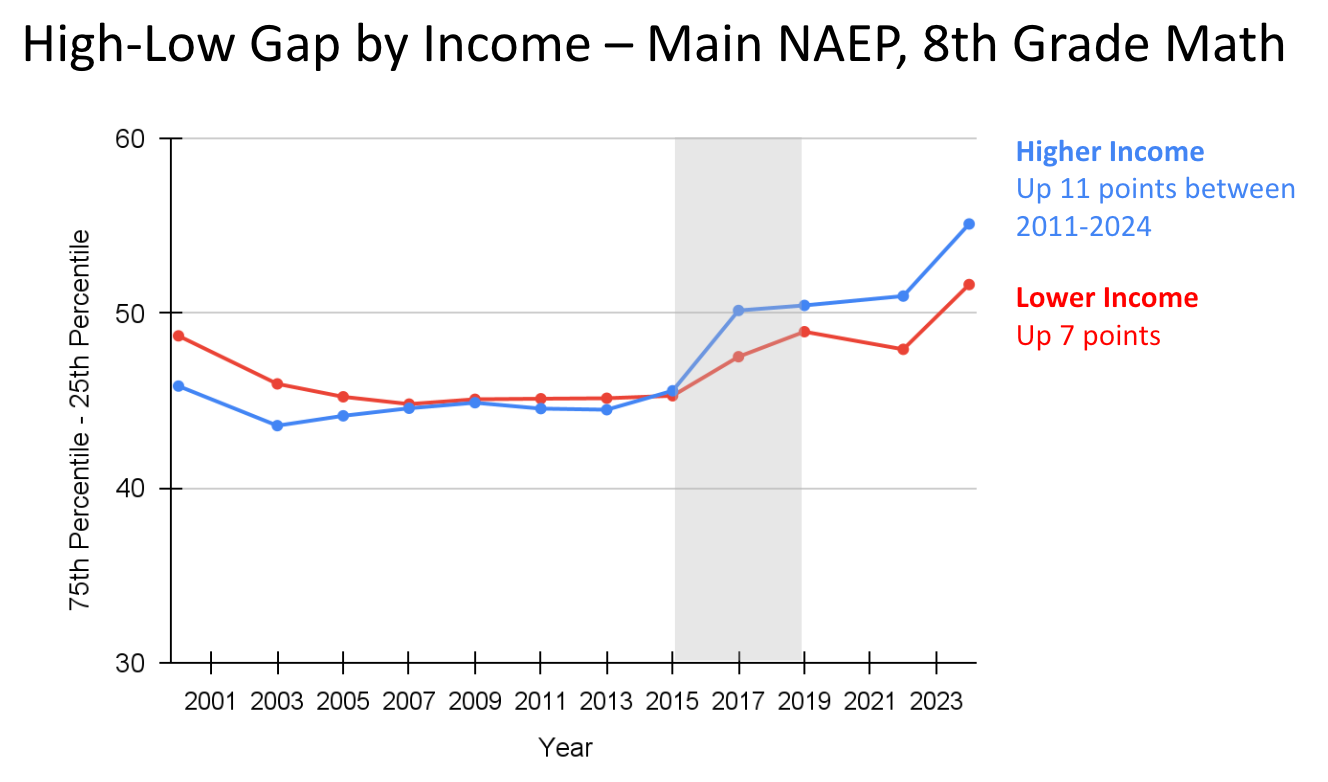
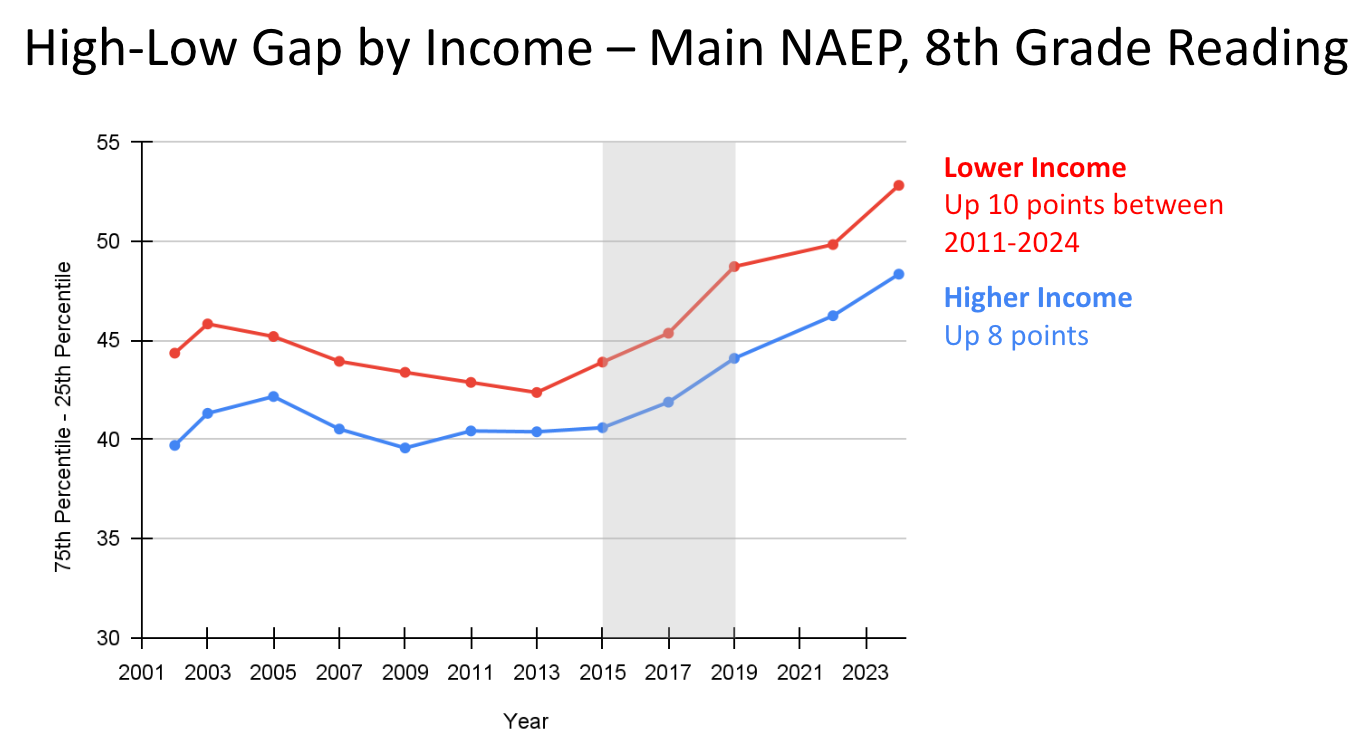
Income
The same trend holds within income groups. As Figure 19 and 20 show, the performance gap between the top- and bottom-performing students within both low- and high-income groups has been growing since 2015.4
To sum up: The high-low gap has been widening across all subjects (math, reading, and science), assessments (NAEP, PISA, and TIMSS), and grade levels measured in the United States since the mid-2010s. Based on our preliminary exploration of NAEP data, this trend holds true not only across the general student population, but also within every demographic group we examined. Meanwhile, the long-standing achievement gaps between boys and girls, rich and poor, and White and Black students have remained relatively stable over the same period.
This suggests that the widening high-low gap in the United States is not being driven primarily by factors related to race, gender, and income. It reflects a deeper, systemic shift that is affecting students across demographic lines.
Conclusion and Future Directions
Since the mid-2010s, the gap between higher- and lower- performing students has consistently widened across subjects, grade levels, and demographic groups, in all of the best surveys of educational performance in the United States. The trend is too widespread to be dismissed as noise and too important to ignore. Our education system is becoming increasingly inequitable. Something has been disproportionately harming low-performing students, while having far less effect on the highest performers.
What might be driving these trends?
One obvious candidate is the rapid changes in technology use that occurred during this decade. Beginning around 2015, students across regions and demographic groups experienced a massive shift toward device-based education and initiatives aimed at implementing one-to-one computer-to-student ratios. The effects of these devices on achievement may vary depending on students’ levels of conscientiousness, a powerful predictor of academic achievement (note that lower conscientiousness is also associated with phone multitasking in the classroom). These multi-function devices offer endless distraction, and perhaps the top students were better able to maintain focus and resist distraction (which is how they became top students in the first place).
Outside of school, adolescents began sinking significant amounts of their free time into smartphones and social media - and reporting higher rates of depression, anxiety, and loneliness. Perhaps digital technologies – which were sold as products that would decrease inequalities – actually widened them.
These multi-function devices offer endless distraction, and perhaps the top students were better able to maintain focus and resist distraction (which is how they became top students in the first place).
Another potential contributor is the Common Core Standards Initiative, which began in 2010 and involved changes in curricula, school regulations, and assessment methods. Critics of the program argue that it did not achieve its intended goals and some have even argued that it may be a major contributing factor in the adolescent mental health crisis.
In future posts, we will explore these potential hypotheses in more detail. But first, we will also look at high-low gaps in other parts of the world, beginning with an in-depth exploration of the Anglosphere. Our goal is to determine the scale of the widening gap, why it is happening, and what we can do about it.
Though these surveys are not as consistently comparable across years as the NAEP LTT, they renorm their tests very frequently in order to make their scores as comparable as possible. This means that when they change a section or update a tool, they will adjust scores to keep it consistent with previous years.
In this post, our graphs will mark the changes in scores since the beginning of the 2010s. For some of the measures, the achievement gap began to grow around this time. For others, it took off closer to 2015. For the sake of consistency, we will show changes since 2010-12 whenever possible in our graphs.
Though the trends in the 90th-10th graphs may look similar to the 75-25 gap, this is because y-axes have different ranges. Almost always, the increases in the 90th-10th gap are larger than those of the 75th-25th.
 | A guest post by
|
 | A guest post by
|
As a school based SLP for over 25 years, I have witnessed this trend first hand. I work directly with lower performing students and frustratingly watch how their learning is impacted when they are handed a chromebook. This technology creates another barrier to their learning. For example, with the ease of tech, these children are given academic accommodations (i.e. typing rather than writing, speech to text, audio versions of texts and so on) without being provided adequate opportunities to fully develop those skills. While accommodations are important at times, technology has allowed these tools to be used excessively and I would argue reduces the opportunity for children to develop these skills. How can we truly measure the missed opportunities a child with dyslexia has to develop their reading skills when they always have the ability to listen to a story or math problem because it is presented on a screen? How can we accurately measure how giving a child with ADHD a device that is designed to rob their attention and expect them to learn to their fullest potential? How can we expect children with fine motor weaknesses to develop their skills when they are always allowed to type rather than write? Our current education system is so focused on gathering data through progress monitoring using a computer that children who are struggling learners will continue to fall further behind. Add AI to the mix and this gap will grow even wider.
No one will say, write, or research about this: the declline began with the disapprearance of two-parent, one at home full-time, households + extreme technology inflicted on developing brains. Put another way, the abandonment of our children to strangers for the years when they are most vulnerable and biologically designed to be near their mothers. (I'm a moderate leftist, so this is not coming from a religious perspective.) That and the fact of public schools being funded by property tax creates the perfect storm.